Demand Prediction for IoT Devices

About TE Connectivity
TE Connectivity is a technology company that designs and manufactures connectivity and sensor products (IOT devices) for harsh environments in a variety of industries, such as automotive, industrial equipment, data communication systems, aerospace, defense, medical, oil and gas, consumer electronics, and energy.
Verticals
• Technology
• Manufacturing
Datasets
• Sales transactions
• Distributor information and inventory
• Product information
• Customer information
• Macroeconomic predictors (appended data from Bloomberg)
Objective
The primary objective was to develop a predictive analytics model for future sales of TE Connectivity distributors. This model would help TE Connectivity make informed investment business decisions for each operational industry vertical.
In order to meet this objective, the student team was tasked with analyzing over ~30M transactions of sales data over three years. These datasets spanned multiple business units in four regions internationally. The challenge to the team also included creating an implementable solution that would help the organization to identify the drivers and opportunities for growth for TE Connectivity’s business in each of the four regions.
Approach
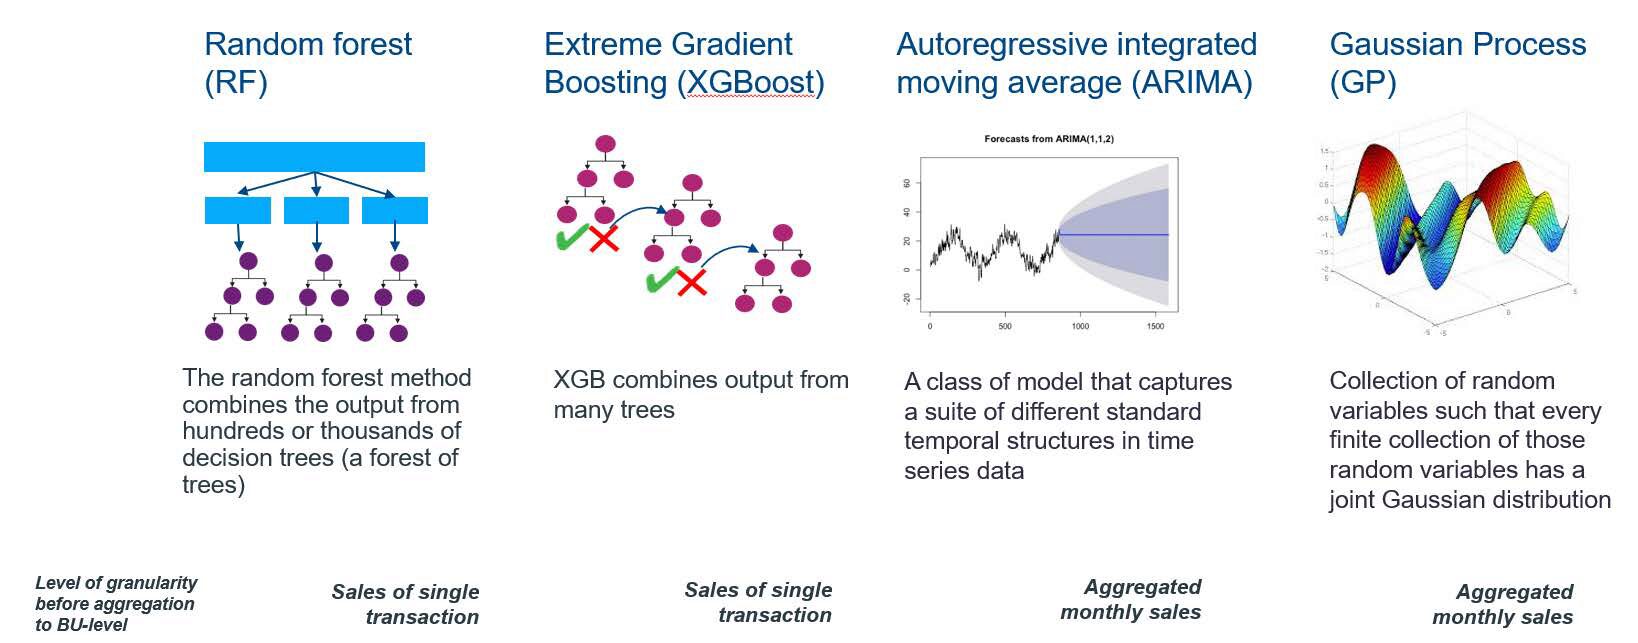
The team’s first step was to attain a deep understanding of TE’s multiple sales transaction datasets by constructing a master database within an AWS cloud environment. Next, they decided to augment the data by incorporating macroeconomic indicators from Bloomberg that were significantly correlated with TE’s distributors’ sales. The team built and tested four machine learning based models – Random Forest, XGBoost, ARIMA, and Gaussian Process.
The team prioritized the “Appliance” business unit in America based on its high sales volume, but the models were scaled to include other top BUs, across other regions, like Asia and EMEA. The team took the average of the results from all 4 models to predict distributor sales for the six largest business units for the upcoming five quarters. When looking at the overall trend, the distributor sales of the six largest units were primarily driven by declines by two business units. The team also took a deeper look at the sales trend at a regional level and determined that sales were mainly driven by the Asia and Japan regions, while the Americas and EMEA regions were projected to be relatively unchanged.
Solution
By using the recommendations provided by the team, TE Connectivity could potentially increase its sales forecasting accuracy to ~95% and generate an additional ~$100M in business value from the six largest business units. The team also suggested that TE could use AI neural networks models to capitalize on the massive amount of transactional data by integrating a Long Short-Term Memory (LSTM) modeling approach.

Impact
TE Connectivity was extremely impressed with the student team’s work and is piloting their proposed solution. The company hired a new full-time employee to their analytics team to take the project forward after receiving the code from the student team. As for the student team members, the engagement leads gained invaluable machine learning modeling experience, while the technical analysts learned more about project management and building scalable models in a big data context.
About the Analytics Accelerator
Every fall and spring semester, Wharton AI & Analytics for Business hosts the Analytics Accelerator, an experiential learning program that pairs students with a company to solve a real-world business problem using the company’s actual datasets and the latest techniques including machine learning and AI.


